
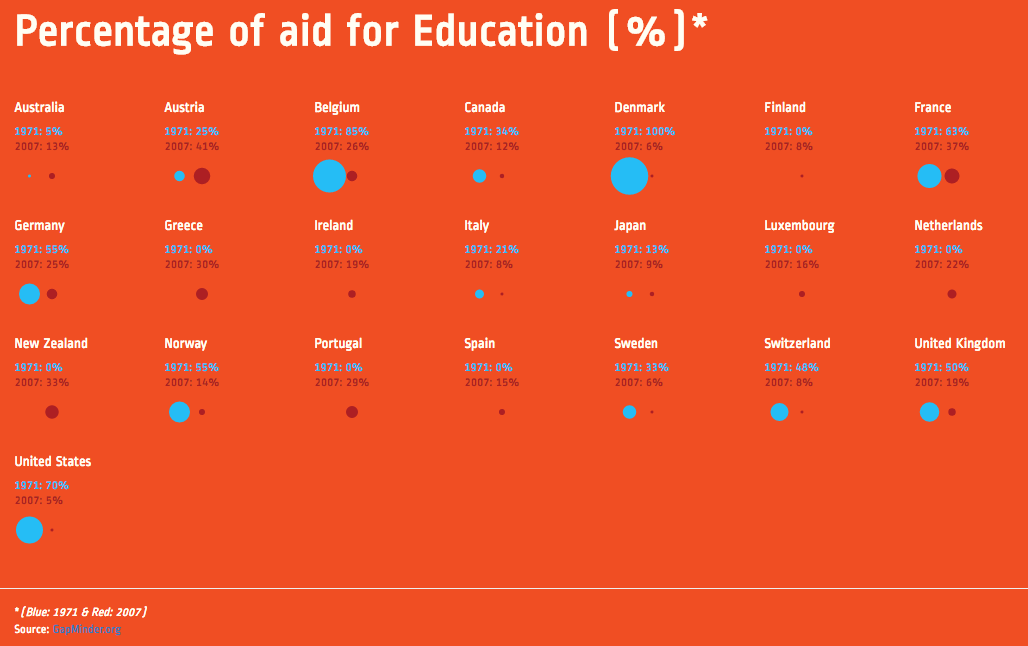
This infographic compares aid allocation for education by country; between years 1971 and 2007. If you click on the image you will find that it’s noteworthy France, Germany, United Kingdom (and other EU countries) and United States have all significantly decreased education spending since 1971.
JSON Data
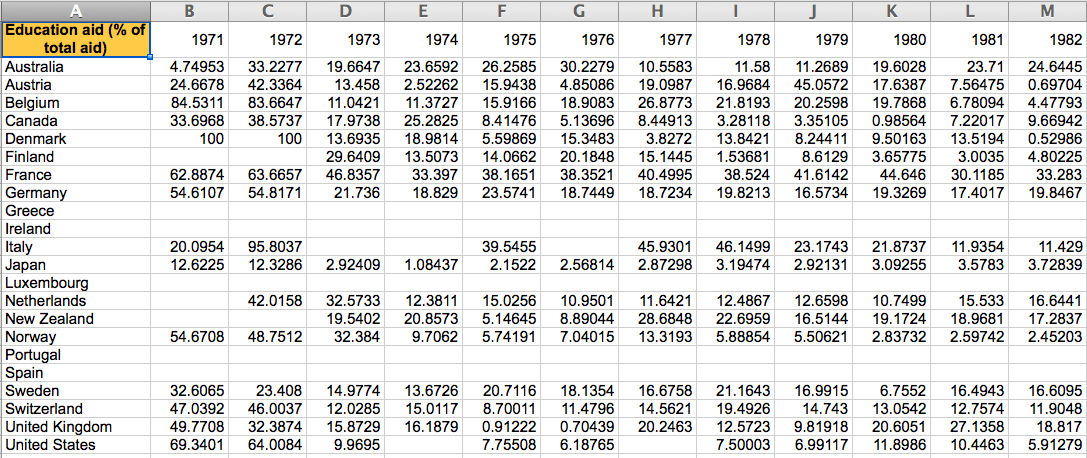
This is what the data looked like in csv form,
And this is when it’s converted to JSON:
var aid = [
  {
    "1971": 4.74952741,
    "2007": 12.08706465,
    "Education aid (% of total aid)": "Australia"
  },
  {
    "1971": 24.6677571,
     "2007": 40.72941569,
    "Education aid (% of total aid)": "Austria"
  },
  {
    "2007": 25.28613701,
    "1971": 84.5310623,
    "Education aid (% of total aid)": "Belgium"
  },
  {
    "2007": 11.03434912,
    "1971": 33.69682112,
    "Education aid (% of total aid)": "Canada"
  },
  {
    "2007": 5.606755586,
    "1971": 100,
    "Education aid (% of total aid)": "Denmark"
  },
  {
    "2007": 7.610016377,
    "1971": 0,
    "Education aid (% of total aid)": "Finland"
  },
  {
    "2007": 36.78546436,
    "1971": 62.88735371,
    "Education aid (% of total aid)": "France"
  },
  {
    "2007": 24.49104562,
    "1971": 54.61067494,
    "Education aid (% of total aid)": "Germany"
  },
.
.
.
  {
     "2007": 14.06700875,
    "1971": 0,
    "Education aid (% of total aid)": "Spain"
  },
  {
    "2007": 5.402764022,
    "1971": 32.6064835,
    "Education aid (% of total aid)": "Sweden"
  },
  {
     "2007": 7.089997613,
    "1971": 47.0391595,
    "Education aid (% of total aid)": "Switzerland"
  },
  {
    "2007": 18.00558138,
    "1971": 49.77079268,
    "Education aid (% of total aid)": "United Kingdom"
  },
  {
    "2007": 4.51867597,
    "1971": 69.3400779,
    "Education aid (% of total aid)": "United States"
  }
];
Next, in a file called index.js, we create a variable for each json value that we want represented on our web-page. countryEduAid is the object we store it in:
JavaScript
var countryEduAid = {};

_.each(aid, function(datum){
	console.log(datum);

	var countryName = datum['Education aid (% of total aid)'];
	var eduAid71 = datum['1971'];
	var eduAid07 = datum['2007'];

	countryEduAid[countryName] = { eduAid71: eduAid71, eduAid07: eduAid07};
});
Using the _.each (from the javascript underscore library) we plot values to populate text and circles for years 1971 and 2007.
_.each(countryEduAid, function(oneCountryEduAidPerPerson, OneCountryName){
	console.log("oneCountryEduAidPerPerson", oneCountryEduAidPerPerson);
	console.log(oneCountryEduAidPerPerson['eduAid07']);
	document.write('<svg class="svg" height="150" width="200">');
	document.write('<text class="country" x="70" y="15" fill="#fffef4">'+ OneCountryName + '</text>');
	document.write('<text x="70" y="65" fill="#ad1f23">'+' 2007: '+ Math.ceil(oneCountryEduAidPerPerson['eduAid07']) + '%' +'</text>');
	document.write('<text x="70" y="45" fill="#25bdf5">'+' 1971: '+ Math.ceil(oneCountryEduAidPerPerson['eduAid71']) + '%' +'</text>');
	document.write('	<circle cx="120" cy="100" r="' + Math.ceil(oneCountryEduAidPerPerson['eduAid07']/4) + '" stroke="nostroke" stroke-width="1" fill="#ad1f23" />');
	document.write('	<circle cx="90" cy="100" r="' + Math.ceil(oneCountryEduAidPerPerson['eduAid71']/4) + '" stroke="nostroke" stroke-width="1" fill="#25bdf5" />');
	document.write('</svg>');
});
HTML & CSS
The results are finally plotted on an HTML/CSS file,
<style>
    body {
    	/*background-image: url('aid_edu_2.jpg');*/
    	background-repeat: no-repeat;
    	background-size: 180px 120px;
    	background-position: bottom;
        margin: 0;
        font-family: 'Ropa Sans';
        color: #fffef4;
        font-size: 12pt;
        background-color: #f04e23 ;

        padding-left: 40px;
    }

    h1 {
        margin: 0;
        font-family: 'Ropa Sans';
        color: #fffef4;
        font-size: 45pt;
        padding-top: 30px;
        padding-bottom: 60px;
        font-weight: 900;
        padding-left: 70px;
    }

     div.footer {
    	color: #fffef4;
    	padding-left: 70px;
    }

   .country{
    	font-size: 19px;
    }

    div.svg {
    	padding-top: 50px
    	margin-top: 50px;
    }

<body>

<h1>Percentage of aid for Education (%)*</h1>
<script type="text/javascript" src="./aid-per-person.js"></script>
<script type="text/javascript" src="./underscore.js"></script>
<script type="text/javascript" src="./index.js"></script>
<style>

</style>

<footer>
	<hr>
	<div class="footer">*<em>(Blue: 1971 & Red: 2007)</em></div>
	<div class="footer">Source: <a href="http://www.gapminder.org/data/">GapMinder.org</div>
	</hr>
</footer>

</body>
This code is in this gitHub repository Once again, the infographic is hosted here