Intro
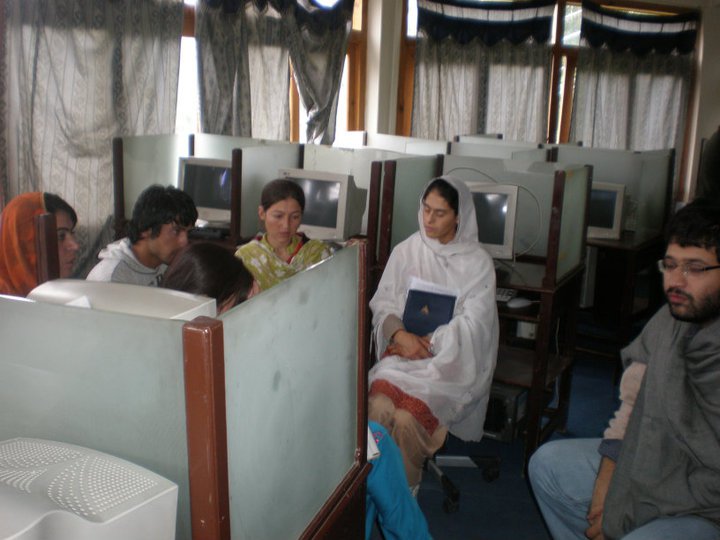
A few years ago I worked with women in N. Pakistan,
Here:
And drew a conclusion that if women are empowered (literate, independent), there will be peace and economic prosperity.
Test & Explore
If there is a correlation between women’s participation in economic and political processes and active conflicts.
Conflict statement
Isolate obvious driving forces of conflict (men, minerals, militias, regional or political interests), over a 25 year period (1991-2006) and take any data available on injustices on women in those regions and draw relationships between peace, prosperity and women empowerment. It’s not going to be easy mining this data so I seek to identify challenges I face and design a technology enabled grass-roots oriented solution for it.
Objective: Infographic & App
Give a mobile enabled visualization of my research as well as an app that address at least one problem area I discsover in the process.
Scope
- effort to keep the scope narrow and lean
- focus on terriotries within countries
- isolate conflicts
- compare data from different conflicts
- online databases
- no interviews, field or survey work (only secondary sources of information)
- Focus on high impact and high influence stakeholders
- women in conflict regions, availability of verifiable data
Data
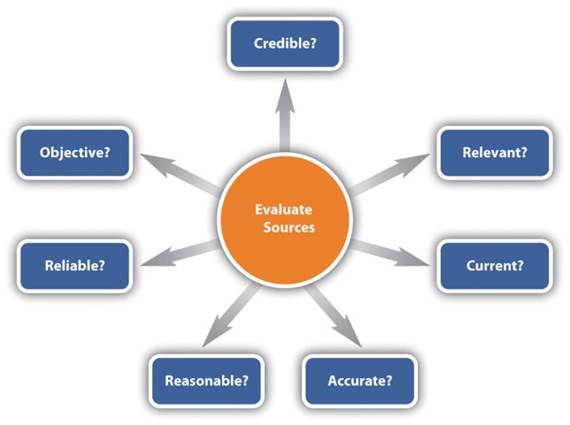
Full Source Analysis
- Reasonable - sanity check
- Reliable - robustness of data over time
- Relevant - gravitationally close to problem
- Credible - source profile
- Current - how recent
- Accurate - data point matching other data points
- Objective - lean - larger question being addressed
*RRR-CCAO
Bell-jar effect
- Too few sources of accurate information, and difficult to verify independently.
- Untouched by the observer effect.
Normalize & Analyze Data
Normalizing data involves,
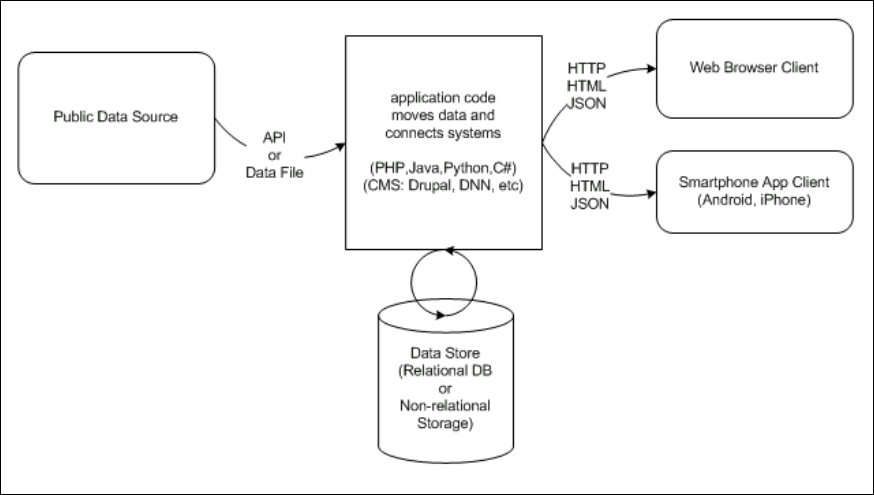
It requires statistical data (in excel is fine) with limited variables to convert to JSON objects with name:value pairs so it can be stored in databases and rendered in browsers using JSON objects.
Data on conflict
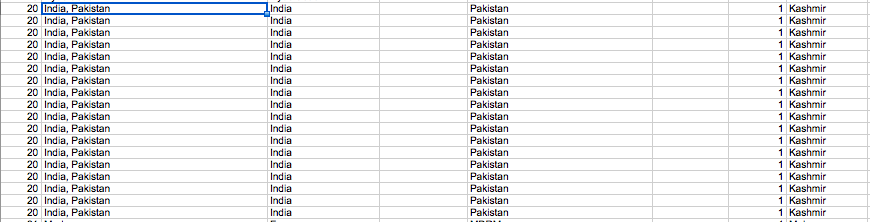
Conflict data doesn’t come like that.
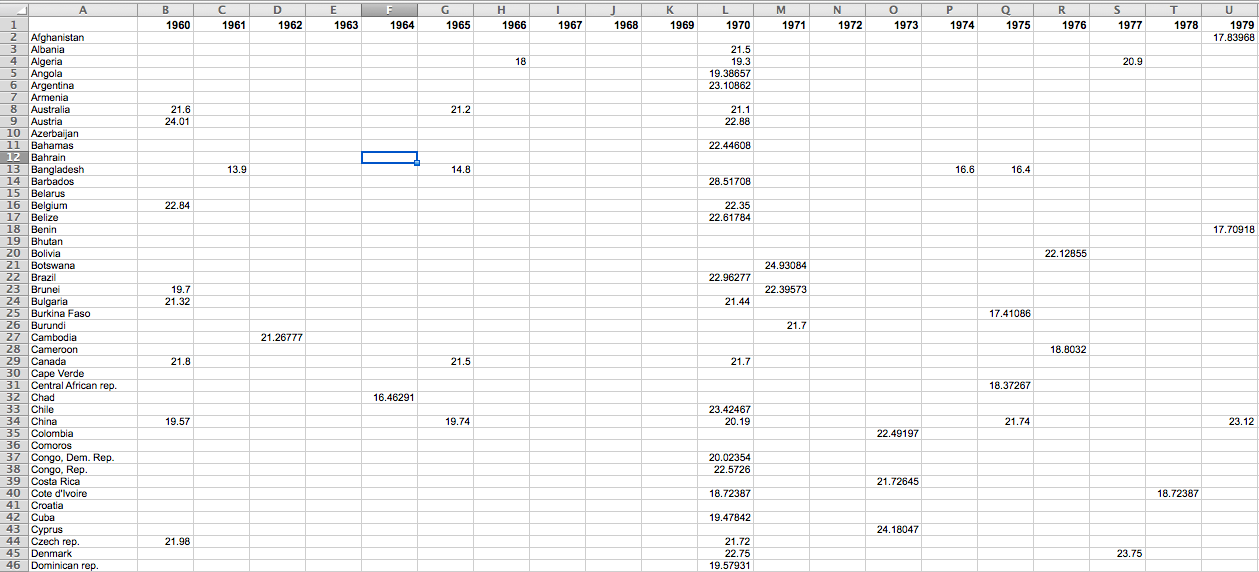
- Amount of data is vast (excel files with 20,000 entries)
- Differentiating between country and region is a challenge
- Multiple of entries due to multiple actors, conflicts in the same region

Data on women
Availibility of data on women is often not statistically aggregated , and not broken down by district or georgraphy.
RRR-CAO: not relevant even if reasonable and credible.

Data and its sources moves fast (news stories, court judgements as sources)
RRR-CAO: even if current, not reliable.
Design (for final)
It was alarming to realize this type of linkage or data work was not easily accessible. I would like to be able to type a location and see statistics on violence on women. So I decided to:
- Simplify scope based on available data
- Analyze data manually to custom fit normalization
- Visualize it (infographic)
- Create an app that addresses data vaccum
Simplify Statistical Available Data
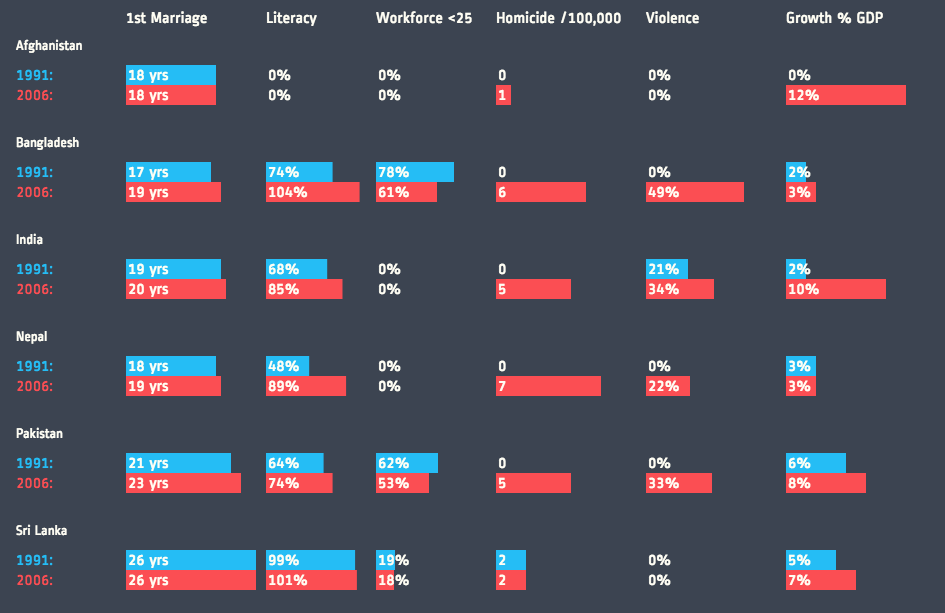
Focus on countries in South Asia (Afghanistan, Pakistan, India, Bangladesh, Sri Lanka, Nepal) - since only country data is available.
- Age at 1st marriage (women)
- Literacy of females to males (% ages 15-24)
- Female workforce (% of female labour force)
- Homicide rate of women (per 100,000 people)
-
Violence on Women - %age in survey
- Economic growth over the past 10 years - done
- //Extreme poverty (% people below $1.25 a day)
Analyze to fit normalization
Excel to simplified CSV to JSON.
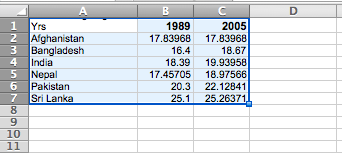
Sample:
var marriage_age = [
  {
    "1989": 17.83968322,
    "2005": 17.83968322,
    "First Marriage Age in Yrs": "Afghanistan"
  },
  {
    "1989": 16.4,
    "2005": 18.66999817,
    "First Marriage Age in Yrs": "Bangladesh"
  },
  {
    "1989": 18.39,
    "2005": 19.93957901,
    "First Marriage Age in Yrs": "India"
  },
  {
    "1989": 17.45704567,
    "2005": 18.97565842,
    "First Marriage Age in Yrs": "Nepal"
  },
  {
    "1989": 20.3,
    "2005": 22.12841225,
    "First Marriage Age in Yrs": "Pakistan"
  },
  {
    "1989": 25.1,
    "2005": 25.26371193,
    "First Marriage Age in Yrs": "Sri Lanka"
  }
]
Visualize it
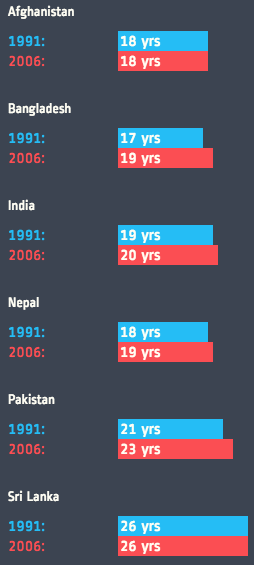
- Website: http://osamasehgol.com:3002/index.html
- Github: https://github.com/osehgol/opendata/tree/master/dev/opendata/WomanData-v2
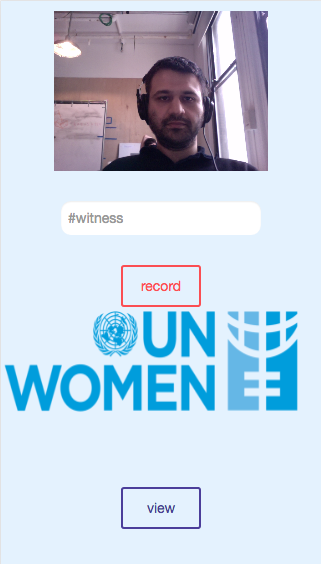
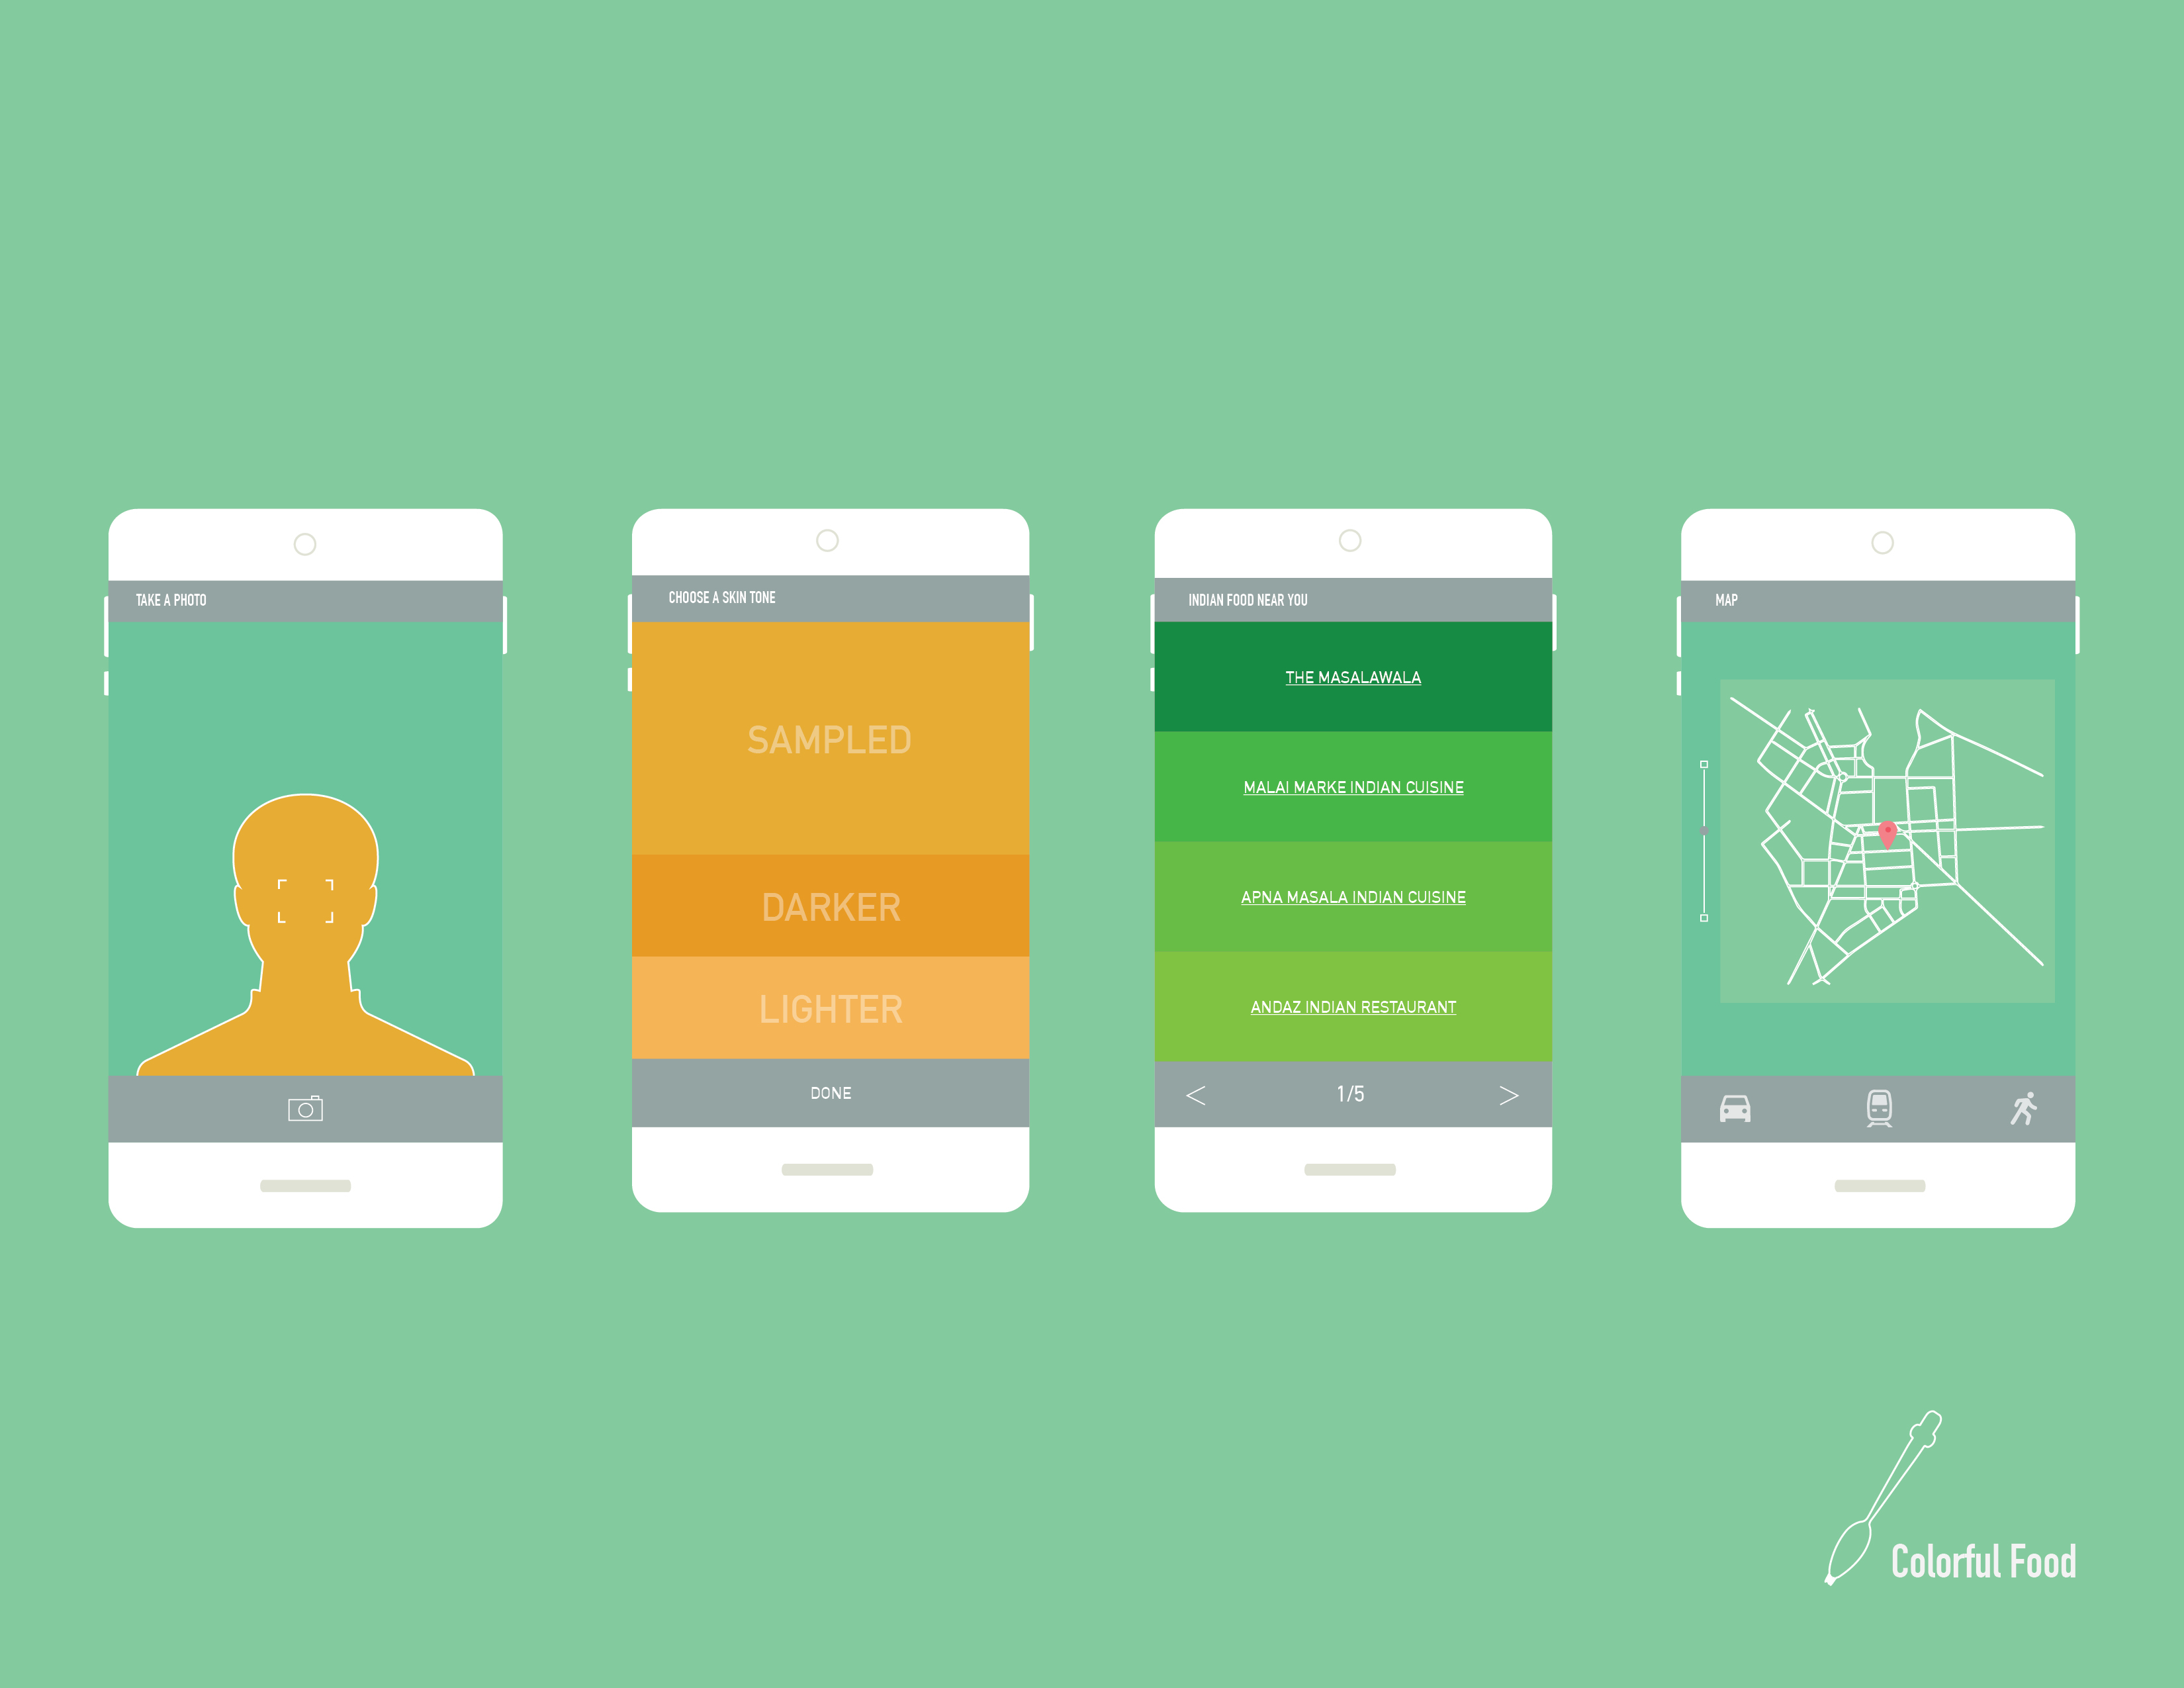
Custom App
https://osamasehgol.com:8080/main.html
- Video recording app
- Auto SMS’s and tweets out your message and evidence
- stored in a secure peer-peer server
- (option to serve it on a regular server)
- Through #, text and geolocation parsing data on injustice can be gathered
Theory of change:
If we’re driving data and visualizing it in real-time, with the explicit purpose of providing justice to women we can map the correlation between their empowerment and peace in conflict regions.